A System Dynamics model using spreadsheets — a case in Healthcare Operations

System Dynamics is a useful way of showing causal relationships, feedback loops, and sources of inertia in systems that vary over time. Spreadsheets are widely available tools that can help to understand how dynamic simulations work, providing a foundation to understand and use other, more complex tools. This article applies spreadsheets to model a case in healthcare logistics.
You can get access to a google sheets example of this simulation here
The fundamentals of system dynamics won't be covered because this article assumes that you are already familiar with them. If you are interested in learning about system dynamics first, I can highly recommend the Roadmaps at the Creative Learning Exchange for introductory System Dynamics material.
Case description

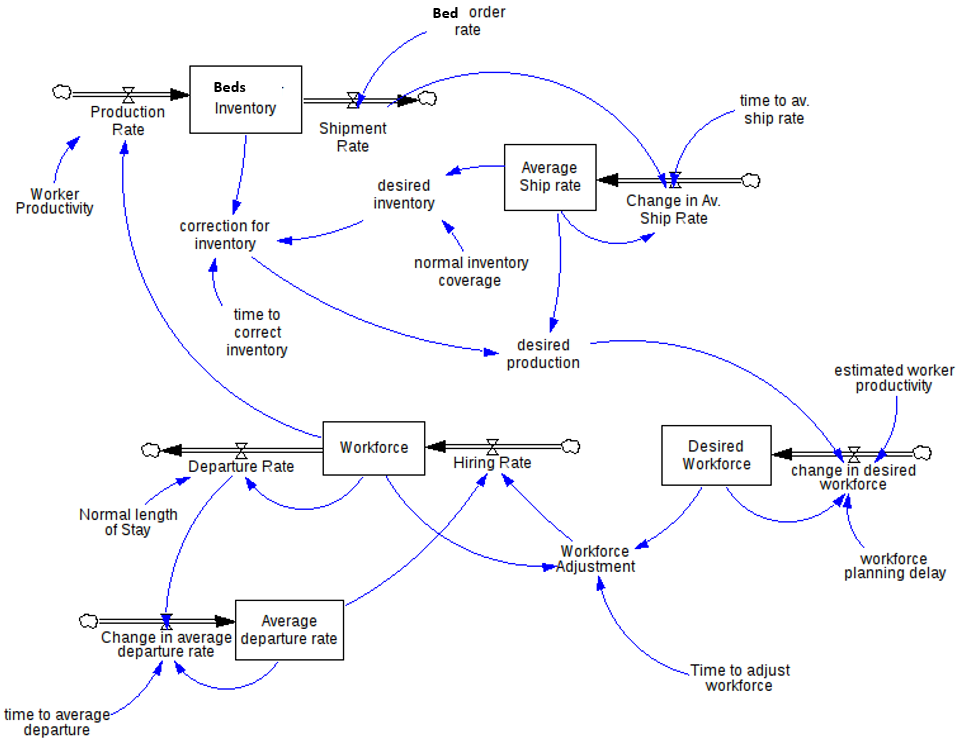
Consider the case of bed logistics in a hospital, and the workforce required to manipulate these beds.
As beds are ordered by hospital operations, a stock of beds is depleted; as fresh beds are cleaned and made available, the stock is refilled.
The stock of beds is continually adjusted to a desired size, which results from the average order sizes in the past.
On the other hand, the desired workforce required for this operation is also dependent on the desired stock, yet the actual workforce size is determined by the number of people that choose to leave the workforce (depleting the workforce stock) and the time it takes to onboard new personnel (replenishing the workforce stock).
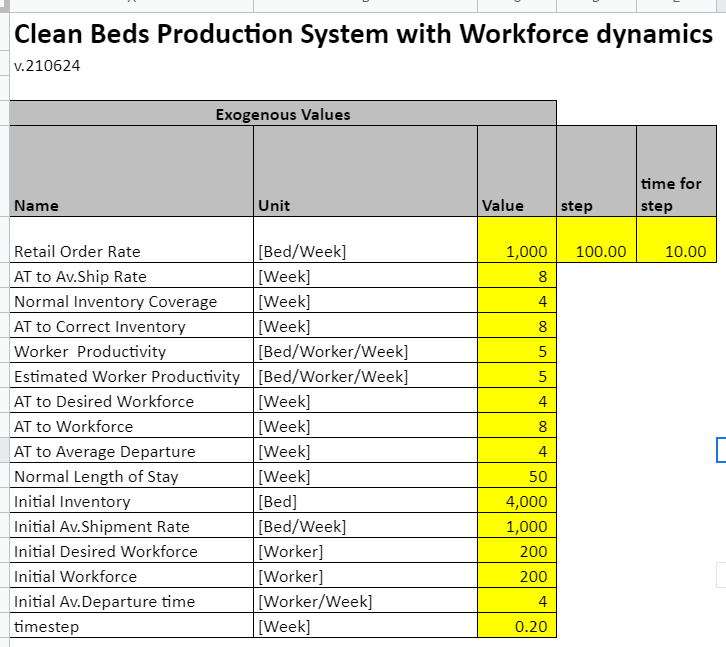
This simulation model includes the following exogenous variables:
And the following Endogenous variables (Stocks, Flows and Auxiliary):

You can get access to a google sheets example of this simulation here
Simulation Results
A 10% increase in the hospital order rate (from 1000 to 1100 beds) results in a transitory 18.3% increase in the required production rate, reaching a maximum of 1183 beds produced per week.
Additionally, the desired stock increases from 4000 to 4400 beds (also a 10% increase), yet the actual stock has a transitory increase of over 22%, reaching a maximum stock of 4894 units.

For the case of the workers, the workforce has seen a transitory increase of over 19% with a hiring spree that led to a 68% increase in hiring rates from 4 per week to almost 7 per week, finally settling at the 10% increase required in the long term.

This simulation shows the feasibility of developing a system dynamics model using spreadsheets, and despite requiring clarity of concepts to keep the simulation understandable (endogenous versus exogenous variables, and a clear separation between stocks, flows, and auxiliary variables in the model), it can be easily reproduced, analyzed, and used for training.
You can get access to a google sheets example of this simulation here